Standard Deviation Calculator Calculate population or sample standard deviation, variance, mean, and range of a dataset.


Standard Deviation Calculator
Calculate population or sample standard deviation, variance, mean, and range of a dataset.
Enter Your Data
Type your numbers separated by commas or spaces in the input field.
Choose Type
Select population (σ) or sample (s) standard deviation.
View Statistics
See standard deviation, variance, mean, count, sum, range, min, and max.
What Is Standard Deviation Calculator?
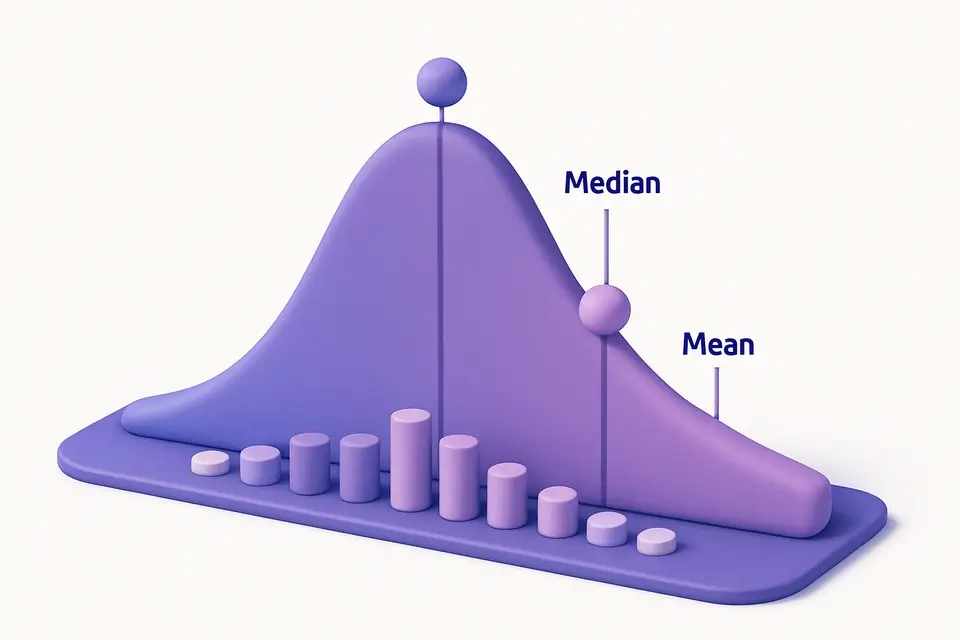
Standard deviation measures how spread out numbers in a dataset are from the mean (average). A low standard deviation means data points cluster near the mean; a high standard deviation means they are spread far from the mean. There are two types: population standard deviation (σ), which divides by N (total population size), and sample standard deviation (s), which divides by N−1 (Bessel's correction for unbiased estimation from a sample). Along with variance (the square of standard deviation), these are the most widely used measures of statistical dispersion. This calculator computes both types along with complementary statistics including mean, sum, count, range, minimum, and maximum. Standard deviation is essential in quality control, scientific research, finance (volatility measurement), psychology (test score distribution), and any field that analyzes data variability.
Why Use Standard Deviation Calculator?
-
Supports both population and sample standard deviation
-
Shows variance, mean, range, and other statistics alongside
-
Accepts any list of numbers separated by commas or spaces
-
Displays the mathematical formula used
-
Instant calculation with no data size limits
Common Use Cases
Academic Research
Analyze the spread of experimental data and report standard deviation in papers.
Quality Control
Monitor manufacturing variation to maintain product consistency.
Finance
Measure investment volatility using standard deviation of returns.
Education
Analyze test score distributions to understand student performance spread.
Technical Guide
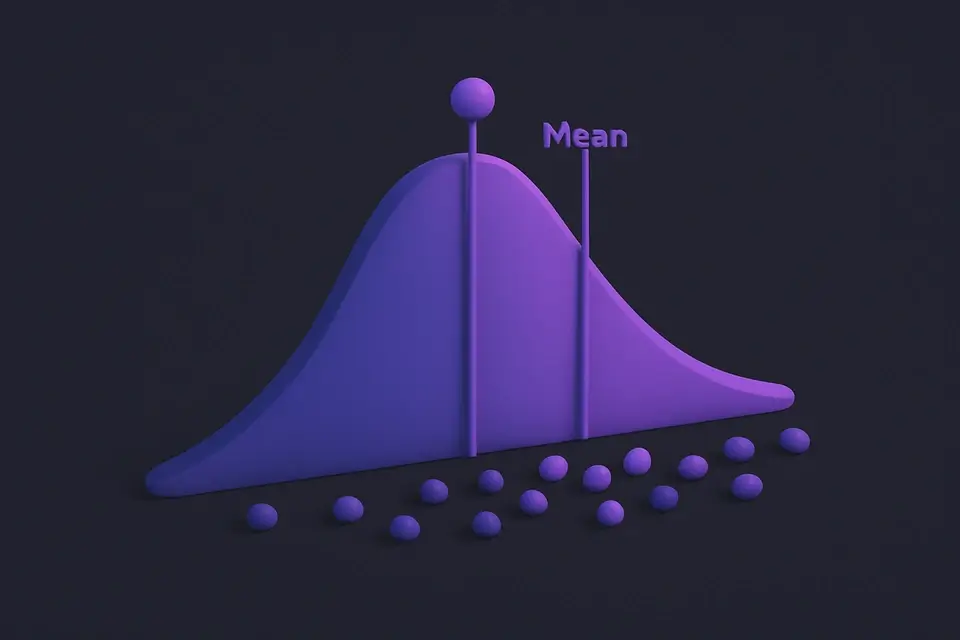
Standard deviation is computed in three steps: (1) Calculate the mean μ = Σxᵢ/n. (2) Calculate the squared differences Σ(xᵢ − μ)². (3) For population SD: σ = √(Σ(xᵢ − μ)²/N). For sample SD: s = √(Σ(xᵢ − μ)²/(N−1)). The N−1 in sample SD is Bessel's correction, which makes s² an unbiased estimator of the population variance. Without it, sample variance systematically underestimates the true population variance. Variance is simply the square of standard deviation. Range (max − min) is a simpler but less informative measure of spread. For normally distributed data, approximately 68% of values fall within ±1σ of the mean, 95% within ±2σ, and 99.7% within ±3σ (the 68-95-99.7 rule). The coefficient of variation (CV = σ/μ × 100%) normalizes spread relative to the mean, useful for comparing variability between datasets with different scales.
Tips & Best Practices
-
1Use population SD (σ) when you have data for the entire population
-
2Use sample SD (s) when your data is a sample from a larger population
-
3For normally distributed data, ~68% falls within ±1 SD of the mean
-
4Standard deviation is in the same units as your data (unlike variance, which is squared)
-
5A low SD relative to the mean indicates consistent data; high SD indicates variability
Related Tools
Mean, Median & Mode Calculator
Calculate mean, median, mode, range, and other central tendency measures for any dataset.
🔢 Math & Calculators

Probability Calculator
Calculate simple probability, union, intersection, conditional probability, and complement.
🔢 Math & Calculators

Percentage Calculator
Calculate percentages, percentage change, and what percent one number is of another.
🔢 Math & Calculators

Hexadecimal Calculator
Perform hexadecimal arithmetic and bitwise operations with multi-base output.
🔢 Math & CalculatorsFrequently Asked Questions
Q What is the difference between population and sample standard deviation?
Q What is variance?
Q When should I use sample vs. population?
Q What does a standard deviation of 0 mean?
Q How many data points do I need?
About This Tool
Standard Deviation Calculator is a free online tool by FreeToolkit.ai. All processing happens directly in your browser — your data never leaves your device. No registration or installation required.