Mean, Median & Mode Calculator Calculate mean, median, mode, range, and other central tendency measures for any dataset.
Mean, Median & Mode Calculator
Calculate mean, median, mode, range, and other central tendency measures for any dataset.
Enter Data
Type numbers separated by commas or spaces.
View Results
See mean, median, and mode displayed prominently.
Explore Details
Check range, midrange, geometric mean, harmonic mean, and sorted data.
What Is Mean, Median & Mode Calculator?
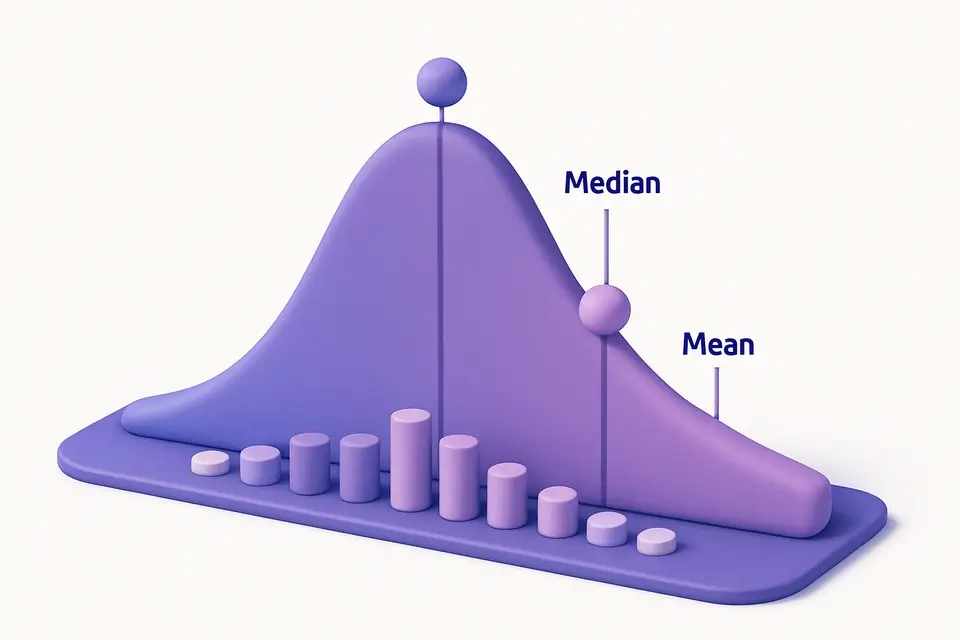
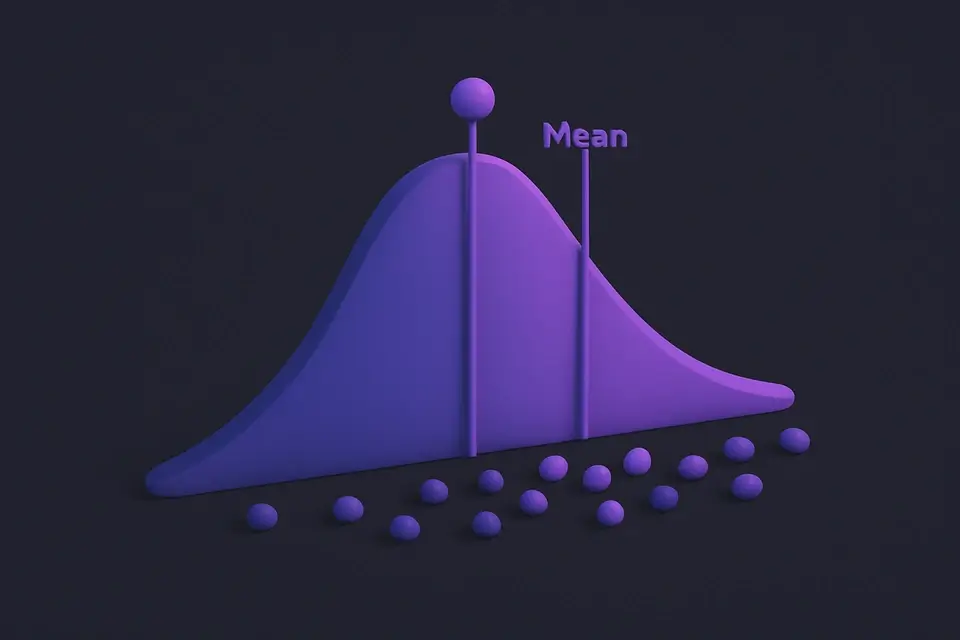
Mean, median, and mode are the three primary measures of central tendency in statistics. The mean (arithmetic average) sums all values and divides by the count — sensitive to outliers. The median is the middle value in sorted data — resistant to outliers and better for skewed distributions. The mode is the most frequent value, usable with non-numeric data. This calculator also computes geometric mean, harmonic mean, range, and midrange for a full statistical profile of your dataset.
Why Use Mean, Median & Mode Calculator?
-
Computes all three central tendency measures simultaneously
-
Includes geometric and harmonic means for specialized applications
-
Shows range and midrange for spread information
-
Displays sorted data for easy visual inspection
-
Handles any dataset size with instant results
Common Use Cases
Data Analysis
Quickly understand the center and distribution of any numerical dataset.
Academic Grading
Calculate class averages and identify the most common score.
Market Research
Find typical customer values using the most appropriate measure of center.
Quality Assurance
Monitor the central tendency of measurements to ensure consistency.
Technical Guide
The arithmetic mean is calculated as μ = Σxᵢ/n. The median is found by sorting the data and taking the middle value (for odd n) or the average of the two middle values (for even n). The mode is found by counting the frequency of each value and selecting those with the highest count; if all values appear equally often, there is no mode. The geometric mean is the nth root of the product of all values: (∏xᵢ)^(1/n), only defined for positive values. It is appropriate for data that is multiplicative in nature, such as growth rates. The harmonic mean is n/Σ(1/xᵢ), also only defined for positive values. It is appropriate for averaging rates (e.g., speeds). The relationship between these means for positive data is: harmonic ≤ geometric ≤ arithmetic (AM-GM-HM inequality), with equality only when all values are identical.
Tips & Best Practices
-
1Use mean for symmetric data without outliers
-
2Use median for skewed data or data with outliers
-
3Mode is the only measure usable with categorical (non-numeric) data
-
4Geometric mean is best for averaging percentages and growth rates
-
5Harmonic mean is best for averaging rates (like speeds)
-
6If mean > median, the distribution is right-skewed; if mean < median, it is left-skewed
Related Tools


Standard Deviation Calculator
Calculate population or sample standard deviation, variance, mean, and range of a dataset.
🔢 Math & Calculators

Probability Calculator
Calculate simple probability, union, intersection, conditional probability, and complement.
🔢 Math & Calculators

Percentage Calculator
Calculate percentages, percentage change, and what percent one number is of another.
🔢 Math & Calculators

Break-Even Calculator
Calculate break-even point in units and revenue with profit/loss projections.
🔢 Math & CalculatorsFrequently Asked Questions
Q Which measure of center should I use?
Q What if there are multiple modes?
Q Why can the mean be misleading?
Q What is the geometric mean used for?
Q When is the harmonic mean appropriate?
About This Tool
Mean, Median & Mode Calculator is a free online tool by FreeToolkit.ai. All processing happens directly in your browser — your data never leaves your device. No registration or installation required.