Visualize RGB and Luminance Distribution Across Your Image Visualize the color distribution of an image with RGB and luminance histograms.
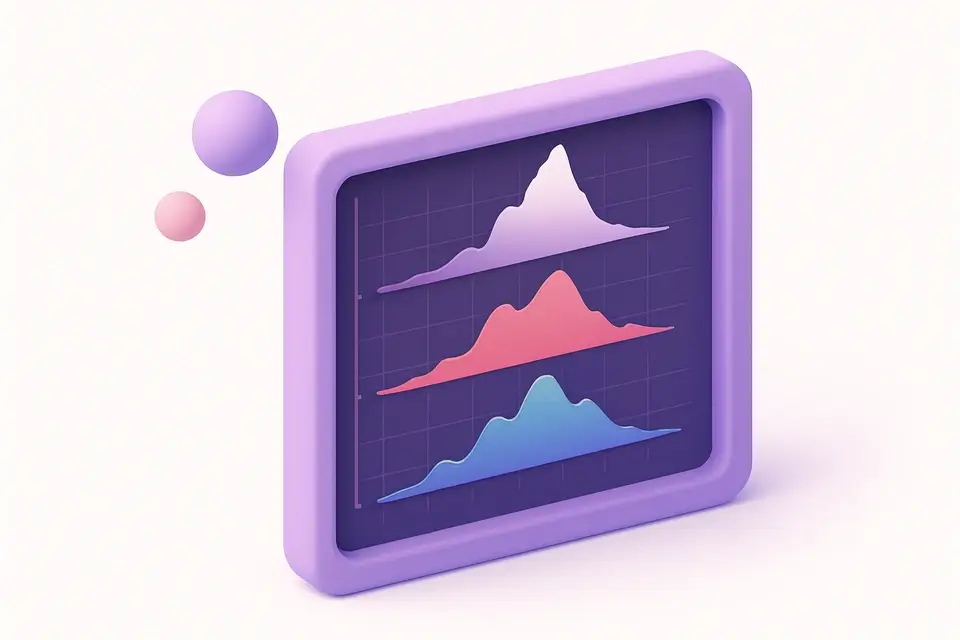
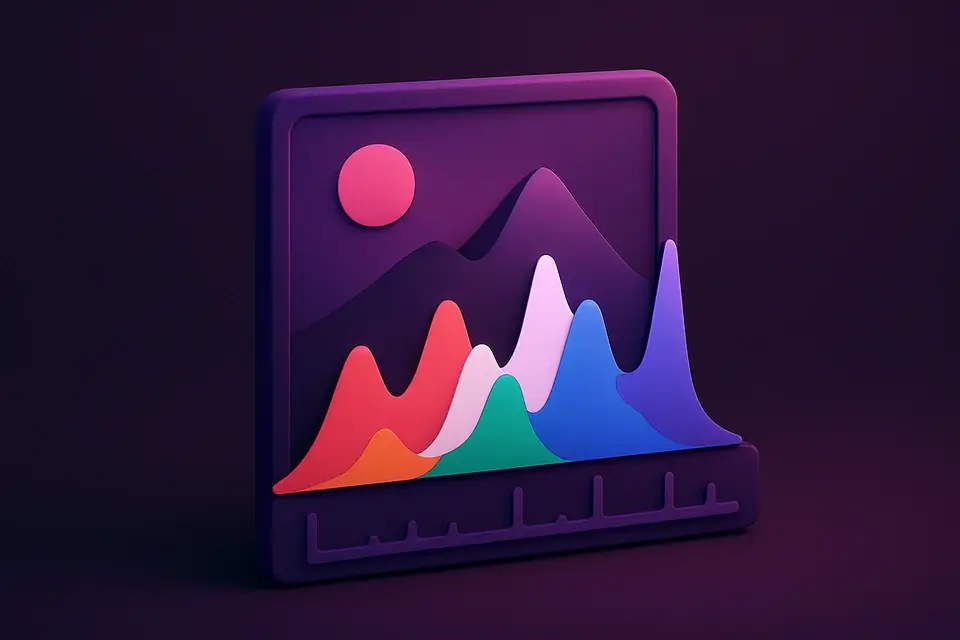
Image Histogram
Visualize the color distribution of an image with RGB and luminance histograms.
Upload Image
Drop or select an image to analyze its color distribution.
View Histograms
See RGB channel and luminance distribution graphs.
Analyze Colors
Examine peaks, shadows, midtones, and highlights.
What Is Image Histogram?
An image histogram is a graphical representation of the distribution of pixel values in an image, typically displayed as a graph showing the number of pixels at each intensity level from 0 to 255. Photographers and image editors use it to analyze exposure, contrast, and color balance in their photographs, solving specific problems like underexposure or overexposure by identifying peaks and troughs in the histogram. For instance, a peak on the left side of the graph indicates an abundance of shadows, while a peak on the right side represents highlights.
The tool is designed to display four separate graphs: Red, Green, Blue, and Luminance channels, allowing users to visualize the color distribution of their image. What makes this tool different is its ability to analyze images up to 1024 pixels wide, resizing them while maintaining aspect ratio, and then generating a histogram for each color channel. It also calculates luminance values using the standard formula: 0.299 * Red + 0.587 * Green + 0.114 * Blue.
This approach enables precise image analysis, as users can inspect the RGB histogram and color histogram to identify imbalances in their image's color distribution. By examining these graphs, photographers and editors can make informed decisions about adjustments to exposure, contrast, and color balance, ultimately improving the overall quality of their images.
Why Use Image Histogram?
-
Separate R, G, B and Luminance channel graphs
-
Identify exposure problems and color casts
-
Analyze shadow, midtone, and highlight distribution
-
Essential for photography and color correction
Common Use Cases
Photography
Check exposure and dynamic range of photos before and after editing.
Color Correction
Identify color casts by comparing RGB channel balance.
Print Preparation
Ensure images have proper tonal range for quality prints.
Image Quality
Detect clipping, underexposure, or overexposure issues.
Technical Guide
Under the hood, it uses React Hooks like useState and useRef to manage state and references to HTMLCanvasElement instances. The analyze function utilizes the Canvas API's getImageData method to extract pixel data from the uploaded image, which is then processed into 256-bin arrays for each color channel (Red, Green, Blue) and luminance. This processing involves iterating over the pixel data in increments of 4 bytes (representing the RGBA values), tallying the occurrences of each intensity value (0-255) in the respective arrays.
The luminance calculation is performed using the standard formula: 0.299 * Red + 0.587 * Green + 0.114 * Blue, where the coefficients represent the relative sensitivity of human vision to different wavelengths of light. These calculations are done on a per-pixel basis, resulting in an array of 256 luminance values that represent the distribution of brightness in the image. When rendering the histograms, it uses individual Canvas elements for each color channel and luminance, with the fillRect method drawing colored bars scaled to the maximum bin count.
To handle file uploads, it employs a FileDropzone component from the React library, which accepts files with an "image/*" MIME type and triggers the handleFile callback when a file is dropped or selected. This callback creates a URL object for the uploaded image using URL.createObjectURL, which is then passed to the analyze function for processing. The resulting histograms are displayed alongside the original image, allowing users to visualize and compare the color distribution of their images.
The histograms themselves are rendered as a series of colored bars, where the x-axis represents intensity values ranging from 0 (black) to 255 (white), and the y-axis represents the count of pixels at each intensity level. The height of each bar is scaled relative to the maximum bin count, providing a visual representation of the distribution of pixel values in the image. By examining these histograms, users can identify imbalances in their image's color distribution, such as overexposure or underexposure, and make informed decisions about adjustments to exposure, contrast, and color balance.
The tool also employs React's useEffect Hook to manage the lifecycle of the uploaded image and its associated URL object, ensuring that resources are properly cleaned up when the component is unmounted or the user navigates away. Specifically, it uses the URL.revokeObjectURL method to release any system resources associated with the uploaded image, helping to prevent memory leaks and maintain application performance.
Tips & Best Practices
-
1A well-exposed image has a spread across the full histogram
-
2Clipping at edges means lost detail in shadows or highlights
-
3Compare RGB channels to detect color cast
-
4Use before/after histograms to evaluate edits
Related Tools
Image Color Picker
Click anywhere on an image to pick the exact color value in HEX, RGB, and HSL.
🖼️ Image Tools
Base64 to Image
Decode Base64 strings or data URIs back into viewable, downloadable images.
🖼️ Image Tools

Image Noise Add
Add film grain or random noise to images for vintage or textured effects.
🖼️ Image Tools

Image Grid Maker
Split a single image into a grid of equal-sized tiles for Instagram grids and puzzles.
🖼️ Image ToolsFrequently Asked Questions
Q What is a histogram?
Q What do the colors mean?
Q How do I read clipping?
Q Can I export the histogram?
Q Does it modify the image?
About This Tool
Image Histogram is a free online tool by FreeToolkit.ai. All processing happens directly in your browser — your data never leaves your device. No registration or installation required.