Build Visual Project Timelines and Gantt Charts Create simple project timelines and Gantt charts with task scheduling and milestone tracking.
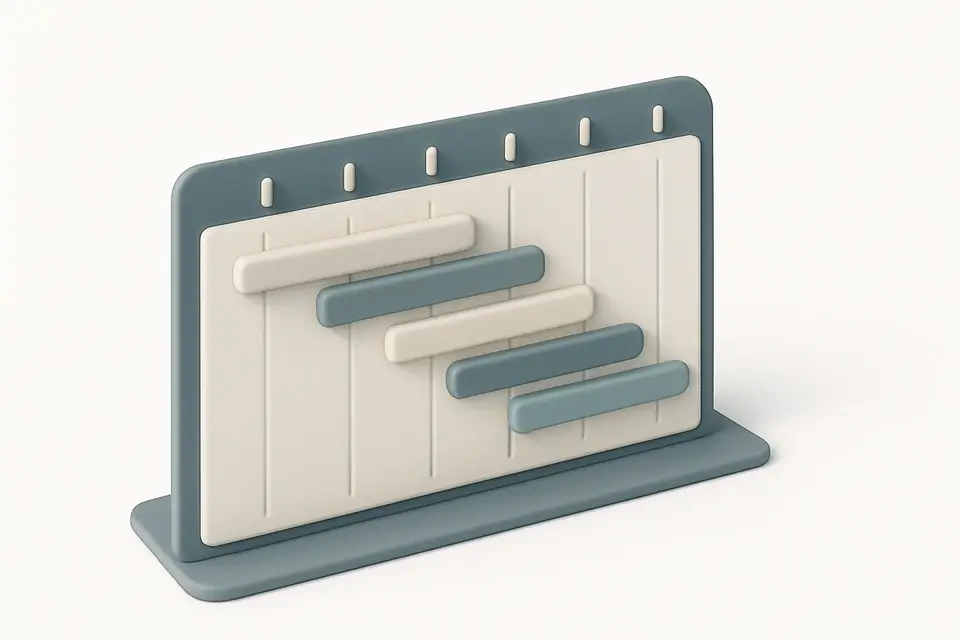
Project Timeline Generator
Create simple project timelines and Gantt charts with task scheduling and milestone tracking.
Add Tasks
Enter each task with a start date, end date, and description.
View Timeline
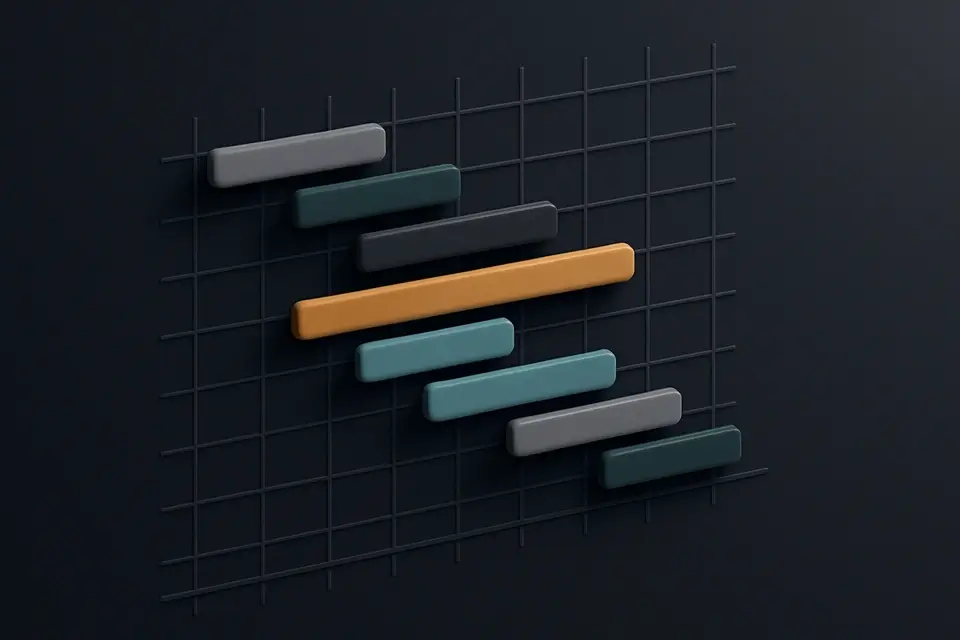
See tasks displayed as color-coded bars on an auto-scaling time axis.
Export
Print the chart to PDF or take a screenshot to share.
What Is Project Timeline Generator?
A Project Timeline Generator is a specialized project planning tool that creates visual representations of tasks and timelines, helping teams organize and manage complex projects. Typically used by product managers, project coordinators, and team leaders, it solves the specific problem of identifying scheduling conflicts and overlaps between multiple tasks, which can lead to delayed project delivery.
It achieves this by allowing users to add tasks with specific start and end dates, descriptions, and color codes, which are then displayed as horizontal bars on a time axis, creating a Gantt chart. What makes this tool different is its ability to auto-scale the timeline based on the task duration, ensuring that the entire project timeline fits within the visible area, and its use of month markers to provide context to the timeline.
The tool also includes features like a free-form text input for task names, date pickers for start and end dates, and a color picker for customizing the appearance of each task bar, making it an ideal choice for creating project timelines without requiring extensive training or enterprise-level software. By using this free online project timeline tool, teams can create detailed project schedules, identify potential conflicts, and make informed decisions about resource allocation, ultimately leading to more efficient project planning and execution.
Why Use Project Timeline Generator?
-
Visual timeline
-
Auto-scaling
-
Color-coded tasks
-
Identify overlaps
-
No software needed
Common Use Cases
Software Development
Plan sprints and releases.
Marketing
Visualize campaign phases.
Event Planning
Schedule preparation tasks.
Technical Guide
The tool works under the hood by utilizing React's useState and useMemo hooks to manage task data and compute timeline properties. It stores tasks as an array of objects with id, name, start, end, and color properties, using TypeScript to enforce type safety. The addTask function creates a new task object with a unique id generated from the current timestamp, while the removeTask function filters out the task by its id. The updateTask function updates a specific task property using the spread operator to preserve existing data.
The tool uses JavaScript Date objects for date math calculations, computing the minimum and maximum dates of all valid tasks and calculating the total duration in days. It then applies CSS positioning to render tasks as horizontal bars on the timeline, with left and width properties calculated based on the start date offset and task duration relative to the total timeline duration. The getBarStyle function computes these styles for each task, taking into account the minDate, maxDate, and totalDays values computed by useMemo.
The tool also utilizes CSS classes defined in a separate stylesheet, such as glass-card and glass-input, to style its user interface components. Additionally, it uses React's event handling mechanisms, like onChange and onClick, to respond to user interactions with task input fields and buttons. The getMonthMarkers function generates an array of month marker objects with label and position properties, using the Date object's toLocaleDateString method to format the month labels. These markers are then rendered as absolute-positioned spans within a container element, providing context to the timeline.
Tips & Best Practices
-
1Set project name to display it above the Gantt chart
-
2Update task colors using the color input field
-
3Remove tasks by clicking the '×' button next to each task
-
4Add new tasks by clicking the '+ Add Task' button
-
5Enter valid dates for start and end fields to calculate total days
Related Tools
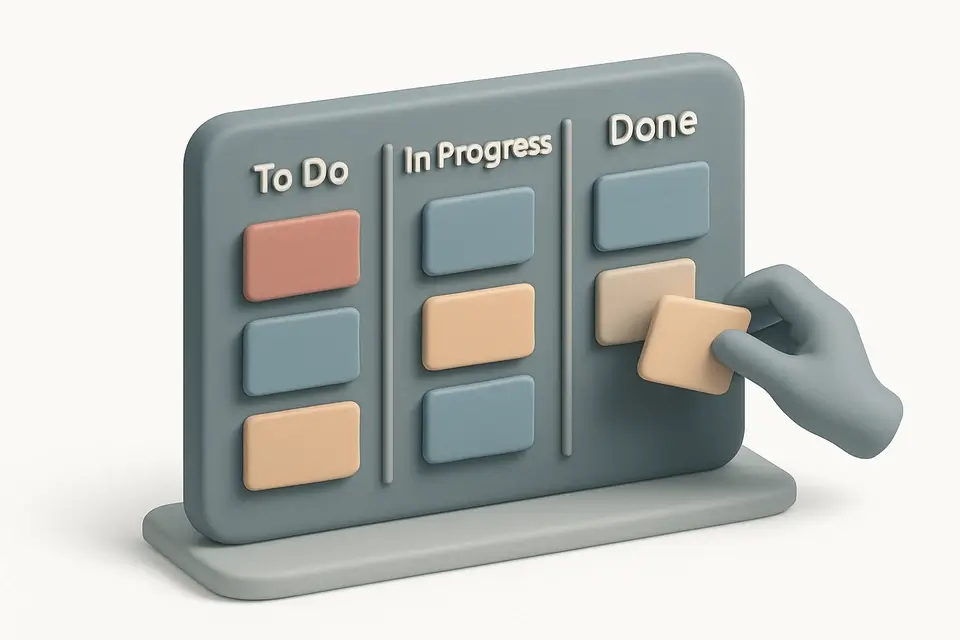
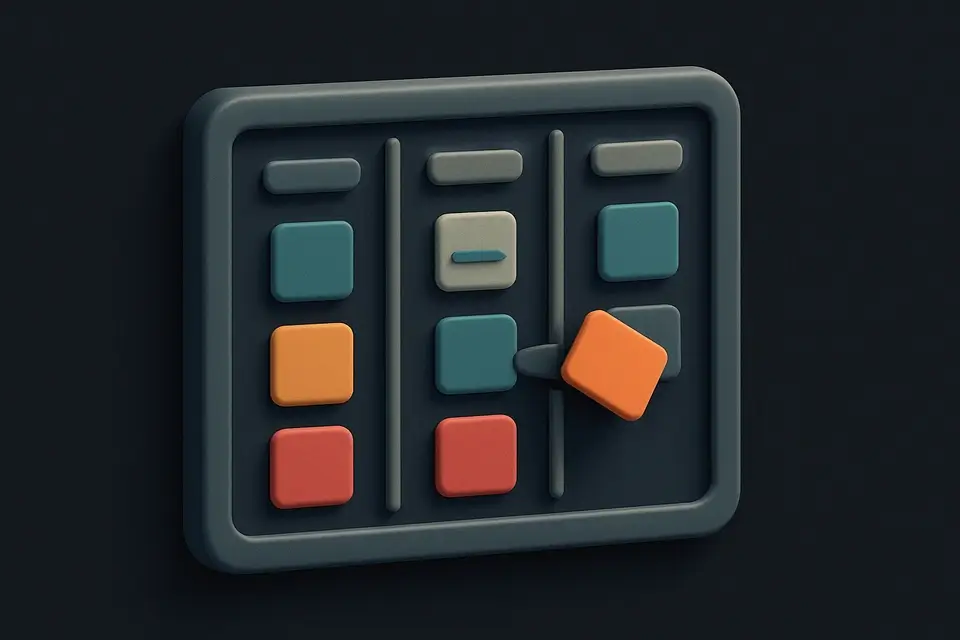
Kanban Board
Organize tasks with a drag-and-drop Kanban board featuring customizable columns and color-coded cards.
🧰 Miscellaneous
Meeting Notes Template
Structured meeting notes template with agenda, attendees, action items, and decision tracking.
🧰 Miscellaneous

Checklist Generator
Create interactive checklists with checkboxes, progress tracking, and easy item management.
🧰 Miscellaneous
OKR Template
Create Objectives and Key Results (OKR) plans with progress tracking and scoring.
🧰 MiscellaneousFrequently Asked Questions
Q Does the timeline generator support task dependencies?
Q How can I export my project timeline?
About This Tool
Project Timeline Generator is a free online tool by FreeToolkit.ai. All processing happens directly in your browser — your data never leaves your device. No registration or installation required.