Audio Spectrum Analyzer Visualize the frequency spectrum of audio files in real-time.
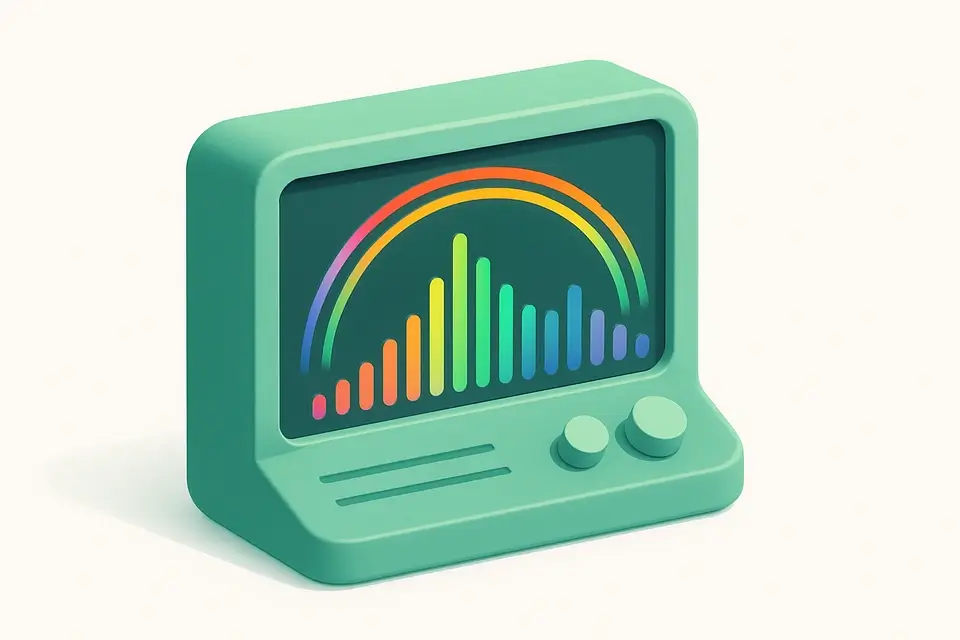
Audio Spectrum Analyzer
Visualize the frequency spectrum of audio files in real-time.
Upload Audio
Drop your audio file or click to browse.
Analyze
Play the audio and watch the real-time frequency spectrum display.
Explore
Identify dominant frequencies and frequency distribution in your audio.
What Is Audio Spectrum Analyzer?
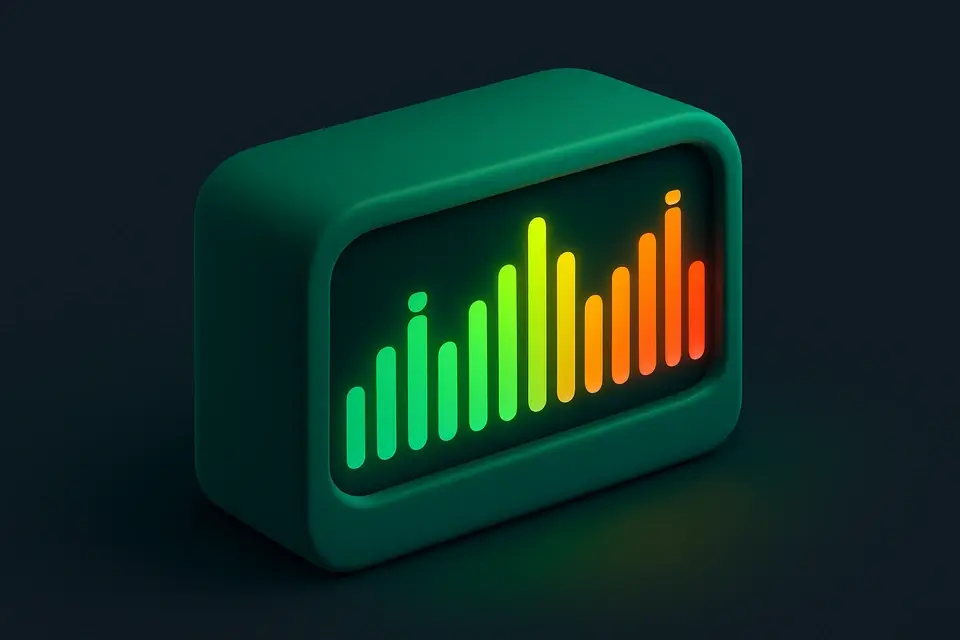
The Audio Spectrum Analyzer displays the frequency content of audio files in real-time. Upload any audio file and play it to see a live visualization of the frequency spectrum — from deep bass to high treble. The analyzer uses the Web Audio API's AnalyserNode to perform Fast Fourier Transform (FFT) analysis, showing how energy is distributed across the audible frequency range. Choose between bar graph and line graph display modes. The display updates in sync with playback, so you can pause, scrub, and compare different sections of a track to pinpoint where specific frequencies appear.
Why Use Audio Spectrum Analyzer?
-
Real-time FFT-based frequency analysis
-
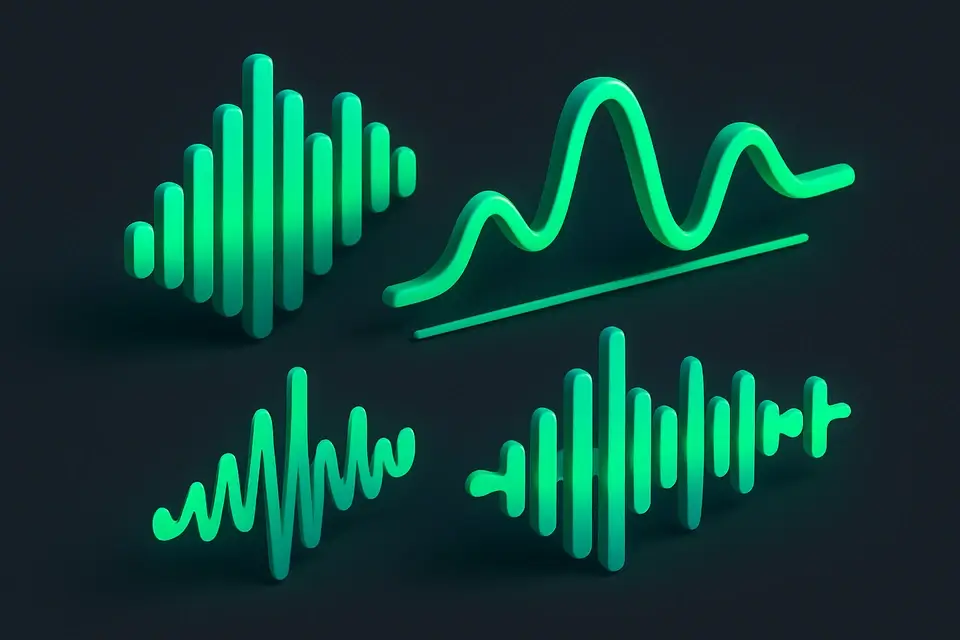
Multiple visualization styles (bars and line graph)
-
Frequency range labels for easy identification
-
Completely client-side — files stay private
Common Use Cases
Audio Analysis
Identify dominant frequencies and frequency balance in recordings.
Troubleshooting
Find problem frequencies like hum, resonance, or harshness.
Mixing Reference
Check frequency balance of mixes against reference tracks.
Education
Visualize and learn about audio frequency content interactively.
Technical Guide
The spectrum analyzer uses the Web Audio API's AnalyserNode, which performs a Fast Fourier Transform (FFT) on the audio signal. The AnalyserNode is configured with an fftSize (typically 2048 or 4096) that determines frequency resolution. The getByteFrequencyData() method returns an array of amplitude values for each frequency bin. The frequency range of each bin is calculated as: binFrequency = binIndex * sampleRate / fftSize. The visualization is rendered on an HTML5 Canvas using requestAnimationFrame() for smooth 60fps updates. Bar mode draws vertical bars for each frequency bin; line mode connects the bin amplitudes with a bezier curve path. The y-axis is scaled logarithmically for better visual representation. The x-axis can be linear or logarithmic (octave-based) spacing.
Tips & Best Practices
-
1Use the spectrum to identify rumble (below 80 Hz) or harshness (2-5 kHz)
-
2A well-balanced mix shows energy across the full spectrum without extreme peaks
-
3Bass content appears on the left, treble on the right of the display
-
4The spectrum analyzer is a diagnostic tool — use the EQ to fix issues you identify
Related Tools
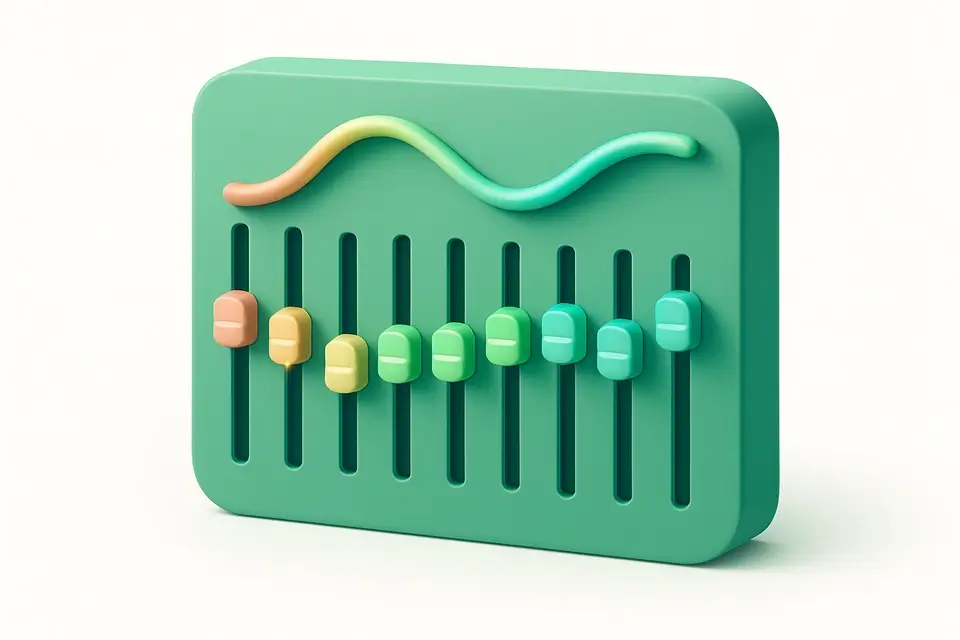
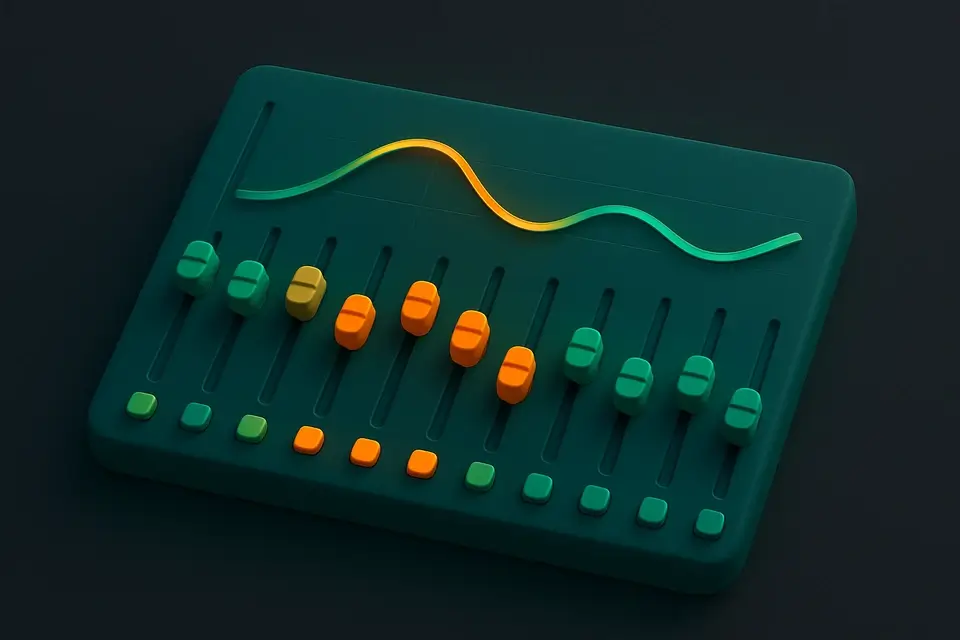
Audio Equalizer
Apply EQ adjustments to boost or cut frequency bands in audio.
🎵 Audio Tools
Audio Compressor
Apply dynamic range compression to reduce volume differences in audio.
🎵 Audio Tools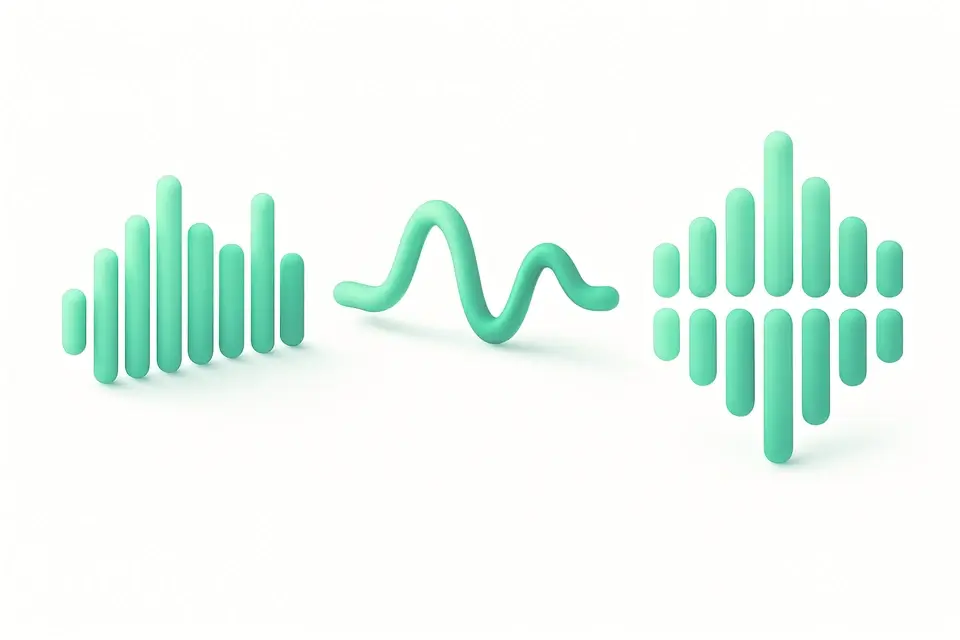
Audio Waveform Generator
Generate a visual waveform image from any audio file.
🎵 Audio Tools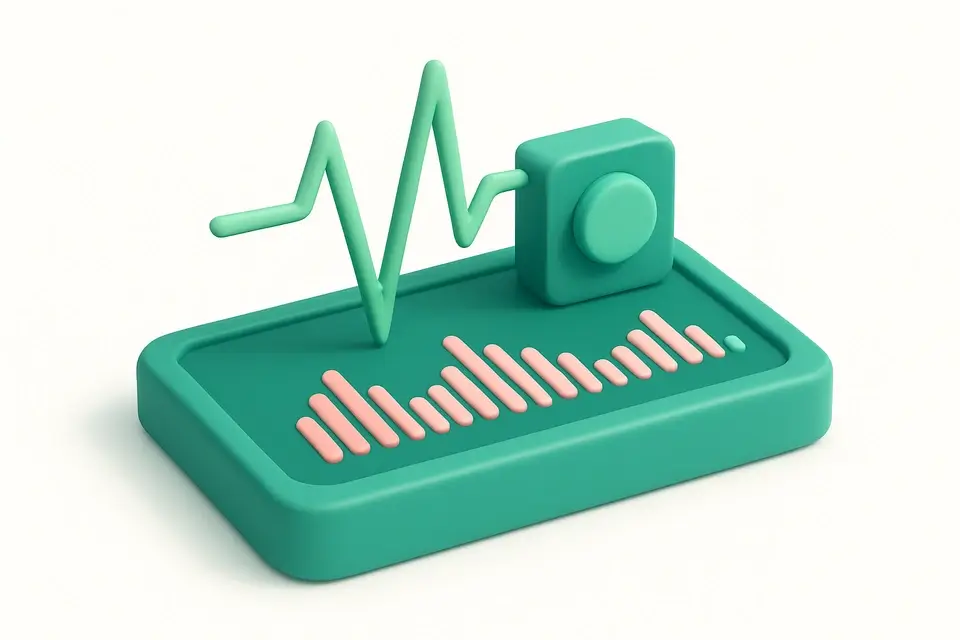
BPM Detector
Detect the tempo (BPM) of any audio or music file.
🎵 Audio ToolsFrequently Asked Questions
Q What is a frequency spectrum?
Q What is FFT?
Q What frequency range is displayed?
Q Is the analysis done in real-time?
Q Is my audio uploaded?
About This Tool
Audio Spectrum Analyzer is a free online tool by FreeToolkit.ai. All processing happens directly in your browser — your data never leaves your device. No registration or installation required.